Viewing and using the reporting dashboard
Where is my dashboard?
It is most likely that the dashboard will end up in the 'root' directory in the drive owned by the user who installed the integration.
If you are using a company account, leave the file in the users drive that installed the integration. If you wish to move it, make a copy manually each time you need an update on another drive.
The file is named "SpokePhoneCallReporting_yyyy-mm.xlsx". Where yyyy-mm-dd is replaced with that date it was installed.
Searching in Office 365 for "SpokePhoneCallReporting" should find the file.
- You can safely move the file to your preferred location within the same Office365 account.
- You can also safely rename the file.
- This specific file is the only file that will be updated with new data. If you duplicate the file and delete the original, the data will no longer be updated, no matter what the name is.
Where is my data?
If installing with the monthlyReporting setting as yes:
- You will get this month's data automatically populated from the start of the month.
- You will get a new file each month.
- The file is updated hourly.
If installing with the monthlyReporting setting as no:
- You will get data from the start of the month, 3 months prior to installing it.
- The file is updated hourly.
If you haven't been using Spoke Phone long, then there may not be any data for many of the months. Use the date filter to select a date range that you expect to see some data.
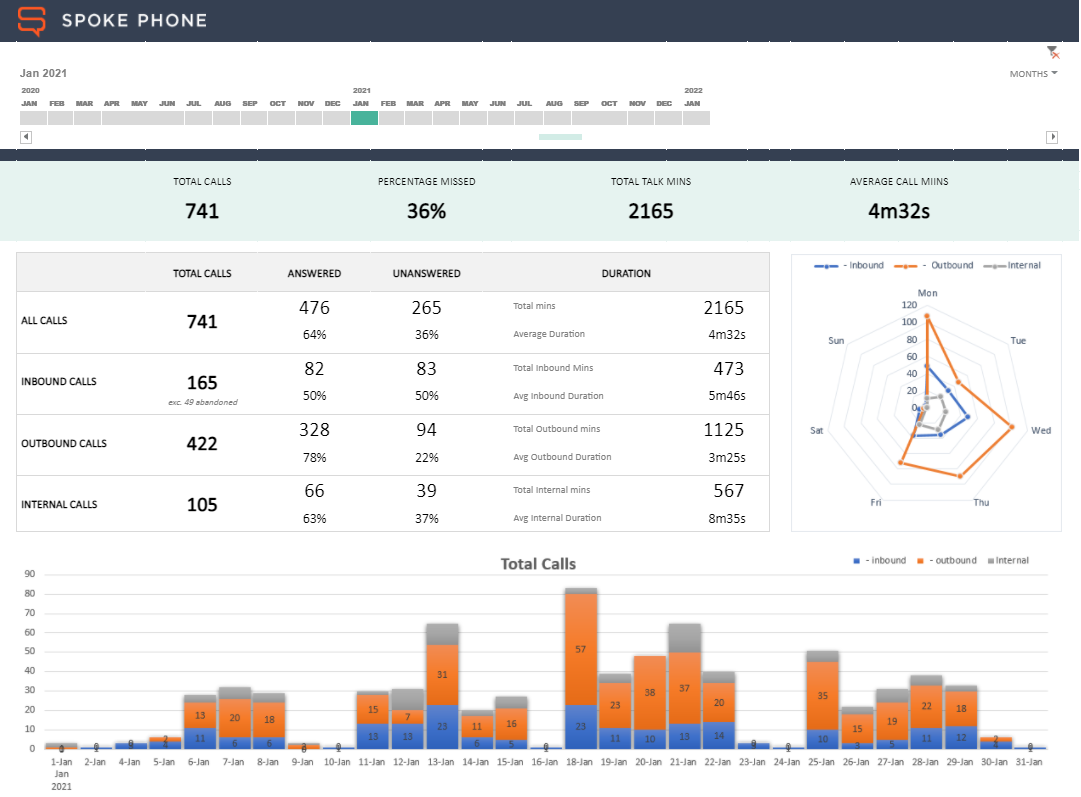
Working with the dashboard
The Excel sheet is organized into four worksheets. For the most part, you should only need to interact with the 'Charts' sheet.
The top section contains the date range picker. You can easily choose a date range, which by default is set up as a month picker. When a date range is selected, the reporting dashboard will redraw with the selected data. You can change the range periods by clicking the top right of the date range picker and selecting from "Years", "Quarters", "Months" or "Days" to get the range you need.
NOTE: If you have a large amount of calls (20,000+), the online version of the dashboard will begin to respond slowly.  Give it a few seconds to update.

You can also use the desktop Excel application which can handle larger datasets much better.

See the section below if you need to restart the reporting in a fresh file, otherwise you can re-install with monthlyReporting set to 'yes' to keep the call size lower.
Diving into the results
If you wish to view the individual call data related to a certain statistic from the dashboard, you can do this. Head on over to the 'ChartPivot' and 'DataPivot' sheets. Within here find the cell you are interested in and simply double click it to open up a new sheet with the source data automatically filtered to the area of interest.
By default a password is placed on these sheets so you cannot edit the contents.
Ensure you clean up any extra sheets you don't wish to keep or simply move them to a new spreadsheet if you wish to further analyze or work with that data separately.
Getting too slow?
If you have 20,000 records or more and are finding things slow, move to the Excel native application rather than the online application in a browser.
If you selected 'no' to the monthlyReporting setting and you're finding it slow, try removing the integration and adding it again with monthlyReporting set to 'yes'.
Otherwise, you can simply remove the integration and then add it again to create a new call reporting dashboard. The new dashboard will begin logging the calls and the old one will no longer be updated.